empty
 
 
17.03.2023 05:52 PM
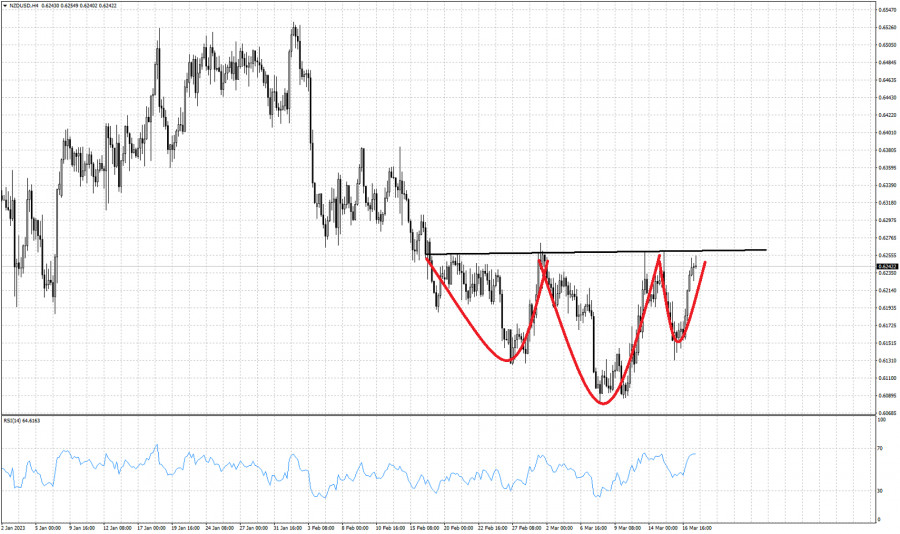
Inverted head and shoulders pattern in NZDUSD.

This image is no longer relevant

Black line- neckline resistance

Red lines- Head and shoulders pattern

NZDUSD is trading around 0.6240 after bouncing from recent low at 0.6131. In the 4 hour chart we observe that the recent bounce was part of a right hand shoulder of a bigger inverted head and shoulders pattern. Price has now reached the neckline resistance of the pattern. For this bullish pattern to be activated we need to see a break above the neckline resistance. This neckline resistance level has so far been tested 5 times. Current price action confirms the importance of this resistance. The bullish pattern gets cancelled if price breaks below the right hand shoulder low of 0.6131. If resistance is broken, our target will be at 0.6440.

NZDUSD
New Zealand Dollar vs US Dollar
Select timeframe
5
min
15
min
30
min
1
hour
4
hours
1
day
1
week
Start trade
Start trade
  • Grand Choice
    Contest by
    InstaForex
    InstaForex always strives to help you
    fulfill your biggest dreams.
    JOIN CONTEST
  • Chancy Deposit
    Deposit your account with $3,000 and get $8000 more!
    In March we raffle $8000 within the Chancy Deposit campaign!
    Get a chance to win by depositing $3,000 to a trading account. Having fulfilled this condition, you become a campaign participant.
    JOIN CONTEST
  • Trade Wise, Win Device
    Top up your account with at least $500, sign up for the contest, and get a chance to win mobile devices.
    JOIN CONTEST
  • 100% Bonus
    Your unique opportunity to get a 100% bonus on your deposit
    GET BONUS
  • 55% Bonus
    Apply for a 55% bonus on your every deposit
    GET BONUS
  • 30% Bonus
    Receive a 30% bonus every time you top up your account
    GET BONUS

Recommended Stories

March 22, 2023 : EUR/USD daily technical review and trading opportunities.

The market has remained under buying pressure until a plateau level occurred around 1.0800-1.0850. This was followed by a significant SELLING price action leading to the recent price decline

Mohamed Samy 13:20 2023-03-22 UTC+2

March 22, 2023 : EUR/USD Intraday technical analysis and trading plan.

Price action around the key-level of (1.0550-1.0600) was quite bullish. That's why, further bullish continuation towards 1.0800 was demonstrated. Moreover, more bullish advancement towards the nearest supply zone around 1.1150-1.1200

Mohamed Samy 13:18 2023-03-22 UTC+2

March 22, 2023 : GBP/USD Intraday technical analysis and significant key-levels.

Please take into consideration that bullish breakout above 1.2340 will probably enable further advancement towards 1.2700. However, the GBPUSD bulls failed to record a new high above 1.2200. Instead

Mohamed Samy 13:17 2023-03-22 UTC+2

GBP/USD forecast for March 22, 2023. UK inflation data disappoints traders

Yesterday, the GBP/USD pair reversed on the 1-hour chart and began to decline towards the lower line of the ascending trend channel. However, it failed to reach the target

Samir Klishi 11:03 2023-03-22 UTC+2

Video market update for March 22, 2023

Potential for the upside continuation on the USD/JPY

Petar Jacimovic 09:37 2023-03-22 UTC+2

Forex forecast 03/22/2023 EUR/USD, USDX, GOLD, SP500 and Bitcoin from Sebastian Seliga

Let's take a look at the technical picture of EUR/USD, USDX, GOLD, SP500 and Bitcoin before the FED interest rate decision

Sebastian Seliga 09:24 2023-03-22 UTC+2

Analysis of Gold for March 22,.2023 - Tight sideways range

Technical analysis: Gold has been trading sideways at the price of $1.941 and I see potential for the breakout mode. In case of the breakout of resistance level at $1.945

Petar Jacimovic 09:12 2023-03-22 UTC+2

USD/JPY analysis for March 22, 2023 - Potential for the bigger uspide movement

Technical analysis: USD/JPY has been trading upside this morning and I found the breakout of the tight bull flag pattern, which is good sign for the further higher prices

Petar Jacimovic 09:07 2023-03-22 UTC+2

Indicator analysis: Daily review of GBP/USD on March 22, 2023

The pound-dollar pair may move upward from the level of 1.2214 (yesterday's daily candle close) to 1.2294, the 76.4% pullback level (blue dotted line). In the case of testing this

Stefan Doll 09:05 2023-03-22 UTC+2

Indicator analysis: Daily review of EUR/USD on March 22, 2023

The euro-dollar pair may move upward from the level of 1.0767 (closing of yesterday's daily candle) to 1.0788, the upper fractal (daily candle from 21/03/2023). Upon reaching this level

Stefan Doll 08:55 2023-03-22 UTC+2
Can't speak right now?
Ask your question in the chat.