empty
 
 
13.12.2023 03:50 PM
GBP/USD: trading scenarios on December 13, 2023

This image is no longer relevant

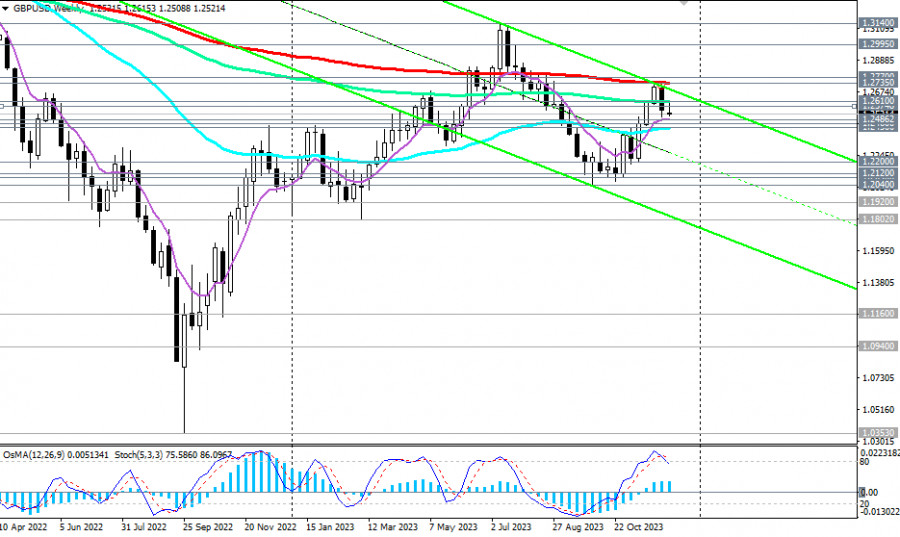
GBP/USD continues to decline after breaking through two important support levels last week at 1.2614 (200 EMA on the 1-hour chart at that time) and 1.2610 (144 EMA on the weekly chart).

As long as GBP/USD remains in the zone of the long-term bearish market, below the key resistance level of 1.2735 (200 EMA on the weekly chart), short positions remain preferable, and currently, a downward trend prevails for the pair.

This image is no longer relevant

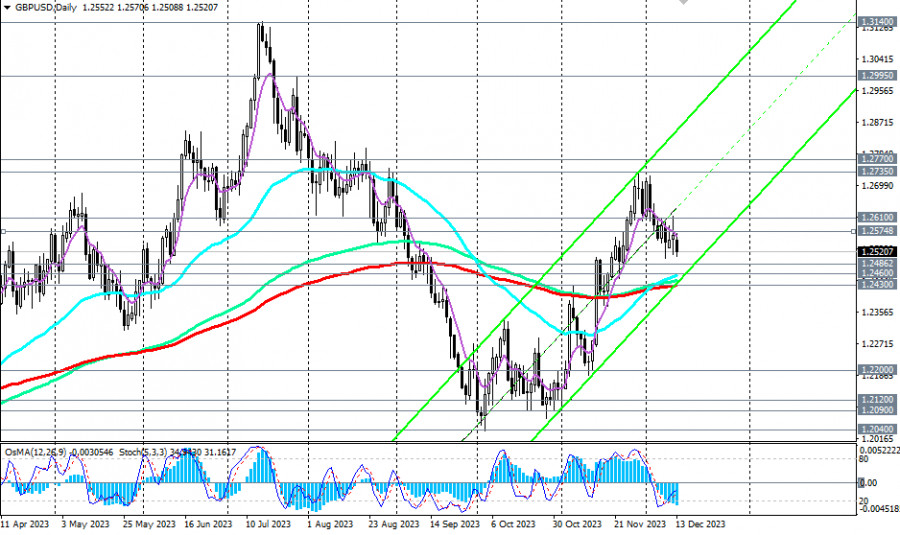
The risks of further GBP/USD decline still outweigh the prospects of its growth. The breakdown of the key support level 1.2430 (200 EMA on the daily chart) will be critical for the currency pair, which will indicate a transition to the medium-term bearish market zone and a resumption of the long-term downward trend.

This image is no longer relevant

The first signal for the development of this scenario is the breakdown of the "round" support level of 1.2500.

It is also noteworthy that on the weekly chart, technical indicators OsMA and Stochastic are starting to turn down, signaling a resumption of decline in the long term.

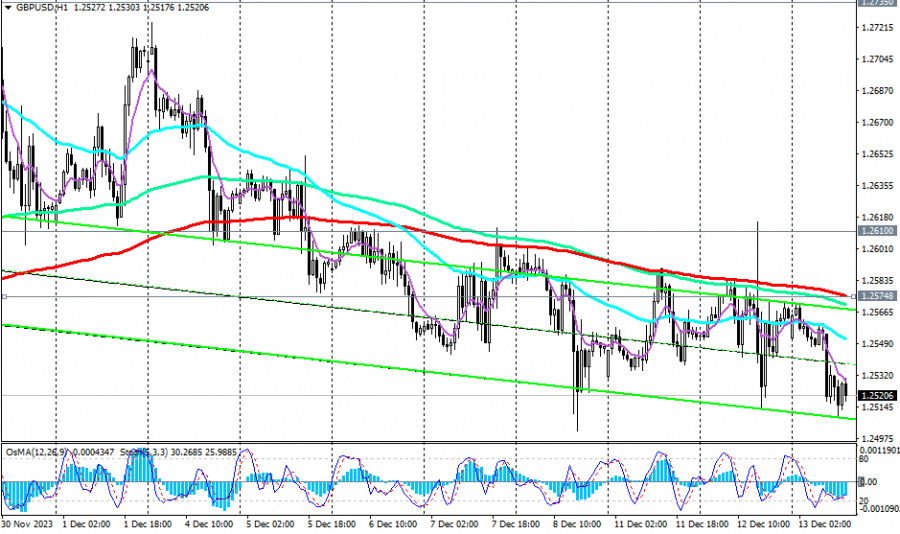
In an alternative scenario and after breaking through the resistance zone at levels 1.2600 and 1.2610, the upward correction will resume. The first signal to implement the alternative scenario is the breakout of the resistance level at 1.2575 (200 EMA on the 1-hour chart at the moment).

However, for a breakout into the long-term bullish market zone, the price must overcome key long-term resistance levels 1.2735 (200 EMA on the weekly chart) and 1.2770 (50 EMA on the monthly chart).

Short positions are preferable at the moment.

Support levels: 1.2500, 1.2486, 1.2460, 1.2430, 1.2400, 1.2300, 1.2200, 1.2120, 1.2100, 1.2090, 1.2040, 1.2000

Resistance levels: 1.2575, 1.2600, 1.2610, 1.2700, 1.2735, 1.2770, 1.2800, 1.2900, 1.2995, 1.3100, 1.3140, 1.3200

Trading Scenarios

Main Scenario: Sell Stop 1.2485. Stop-Loss 1.2575. Targets 1.2460, 1.2430, 1.2400, 1.2300, 1.2200, 1.2120, 1.2100, 1.2090, 1.2040, 1.2000

Alternative Scenario: Buy Stop 1.2575. Stop-Loss 1.2485. Targets 1.2600, 1.2610, 1.2700, 1.2735, 1.2770, 1.2800, 1.2900, 1.2995, 1.3100, 1.3140, 1.3200

"Targets" correspond to support/resistance levels. This also does not mean that they will necessarily be reached, but they can serve as a guide when planning and placing your trading positions.

Jurij Tolin,
الخبير التحليلي لدى شركة إنستافوركس
© 2007-2024
كسب عائد من تغيرات أسعار العملات المشفرة مع إنستافوركس.
قم بتحميل منصة التداول ميتاتريدر 4 وافتح أول صفقة.
  • Grand Choice
    Contest by
    InstaForex
    InstaForex always strives to help you
    fulfill your biggest dreams.
    انضم إلى المسابقة
  • إيداع الحظ
    قم بإيداع 3,000 دولار في حسابك واحصل على $8,000 وأكثر من ذالك!
    في مايو نحن نقدم باليانصيب $8,000 ضمن حملة إيداع الحظ!
    احصل على فرصة للفوز من خلال إيداع 3,000 دولار في حساب تداول. بعد أن استوفيت هذا الشرط، تصبح مشاركًا في الحملة.
    انضم إلى المسابقة
  • تداول بحكمة، اربح جهازا
    قم بتعبئة حسابك بمبلغ لا يقل عن 500 دولار ، واشترك في المسابقة ، واحصل على فرصة للفوز بأجهزة الجوال.
    انضم إلى المسابقة
  • بونص 100٪
    فرصتك الفريدة للحصول على بونص 100٪ على إيداعك
    احصل على بونص
  • بونص 55٪
    تقدم بطلب للحصول على بونص 55٪ على كل إيداع
    احصل على بونص
  • بونص 30٪
    احصل على بونص 30٪ في كل مرة تقوم فيها بتعبئة حسابك
    احصل على بونص

المقالات الموصى بها

لا تستطيع التحدث الآن؟
اطرح سؤالك في الدردشة.
Widget callback