empty
 
 
13.12.2023 03:50 PM
GBP/USD: trading scenarios on December 13, 2023

This image is no longer relevant

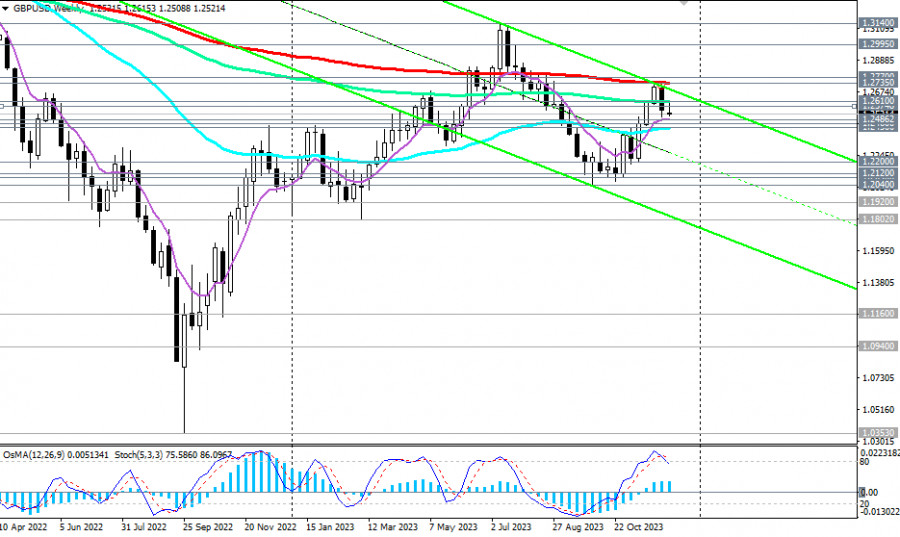
GBP/USD continues to decline after breaking through two important support levels last week at 1.2614 (200 EMA on the 1-hour chart at that time) and 1.2610 (144 EMA on the weekly chart).

As long as GBP/USD remains in the zone of the long-term bearish market, below the key resistance level of 1.2735 (200 EMA on the weekly chart), short positions remain preferable, and currently, a downward trend prevails for the pair.

This image is no longer relevant

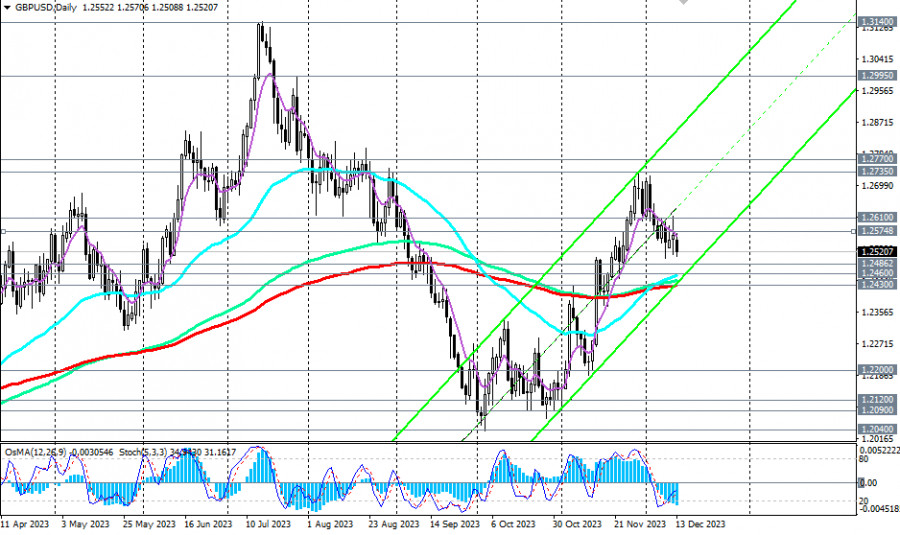
The risks of further GBP/USD decline still outweigh the prospects of its growth. The breakdown of the key support level 1.2430 (200 EMA on the daily chart) will be critical for the currency pair, which will indicate a transition to the medium-term bearish market zone and a resumption of the long-term downward trend.

This image is no longer relevant

The first signal for the development of this scenario is the breakdown of the "round" support level of 1.2500.

It is also noteworthy that on the weekly chart, technical indicators OsMA and Stochastic are starting to turn down, signaling a resumption of decline in the long term.

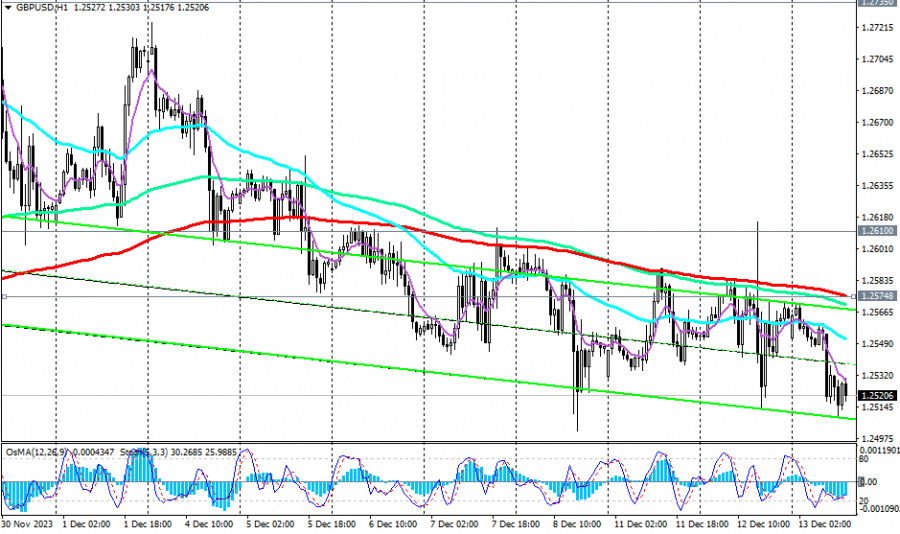
In an alternative scenario and after breaking through the resistance zone at levels 1.2600 and 1.2610, the upward correction will resume. The first signal to implement the alternative scenario is the breakout of the resistance level at 1.2575 (200 EMA on the 1-hour chart at the moment).

However, for a breakout into the long-term bullish market zone, the price must overcome key long-term resistance levels 1.2735 (200 EMA on the weekly chart) and 1.2770 (50 EMA on the monthly chart).

Short positions are preferable at the moment.

Support levels: 1.2500, 1.2486, 1.2460, 1.2430, 1.2400, 1.2300, 1.2200, 1.2120, 1.2100, 1.2090, 1.2040, 1.2000

Resistance levels: 1.2575, 1.2600, 1.2610, 1.2700, 1.2735, 1.2770, 1.2800, 1.2900, 1.2995, 1.3100, 1.3140, 1.3200

Trading Scenarios

Main Scenario: Sell Stop 1.2485. Stop-Loss 1.2575. Targets 1.2460, 1.2430, 1.2400, 1.2300, 1.2200, 1.2120, 1.2100, 1.2090, 1.2040, 1.2000

Alternative Scenario: Buy Stop 1.2575. Stop-Loss 1.2485. Targets 1.2600, 1.2610, 1.2700, 1.2735, 1.2770, 1.2800, 1.2900, 1.2995, 1.3100, 1.3140, 1.3200

"Targets" correspond to support/resistance levels. This also does not mean that they will necessarily be reached, but they can serve as a guide when planning and placing your trading positions.

Jurij Tolin,
ผู้เชี่ยวชาญด้านการวิเคราะห์ของ InstaForex
© 2007-2024
รับผลกำไรจากการเปลี่ยนแปลงอัตราสกุลเงินดิจิทัลกับ InstaForex.
ดาวน์โหลด MetaTrader 4 และเปิดการซื้อขายครั้งแรกของคุณ.
  • Grand Choice
    Contest by
    InstaForex
    InstaForex always strives to help you
    fulfill your biggest dreams.
    เข้าร่วมการแข่งขัน
  • Chancy Deposit
    ฝากเงินในบัญชีของคุณใน $3,000 และรับ $9000 ไปเพิ่ม!
    ใน พฤษภาคม ทางเราได้ออก$9000 ภายในแคมเปญ Chancy Deposit !
    คว้าโอกาสที่จะชนะด้วยการฝากเงิน $3,000 ไปในบัญชีเทรด เมื่อทำตามเงื่อนไขนี้แล้ว คุณก็จะกลายเป็นผู้เข้าร่วมแคมเปญ
    เข้าร่วมการแข่งขัน
  • เทรดให้ดีแล้วคว้ารางวัล
    เติมเงินในบัญชีของคุณอย่างน้อย $500 สมัครเข้าร่วมการแข่งขัน และลุ้นรับรางวัลอุปกรณ์ติดต่อสื่อสารแบบพกพา
    เข้าร่วมการแข่งขัน
  • โบนัส 100%
    โอกาสพิเศษของคุณในการรับโบนัส 100% จากเงินฝากของคุณ
    รับโบนัส
  • โบนัส 55%
    สมัครรับโบนัส 55% สำหรับการฝากทุกครั้ง
    รับโบนัส
  • โบนัส 30%
    รับโบนัส 30% ทุกครั้งที่คุณเติมเงินในบัญชีของคุณ
    รับโบนัส


บทความแนะนำ

หากไม่สะดวกคุยในตอนนี้
ระบุคำถามไว้ได้ใน แชท.
Widget callback